Introduction ⛈️
We made it on Hackaday! https://hackaday.com/2020/07/13/solar-weather-station-listens-for-lightning/
First Post of 2020! Its been a while but I have been working on quite a few projects lately. Out of all the projects I’m working on, the one I’m most excited for is reviving my solar powered weather station. This was something I started back in 2017 but after some hardware failures (due to lightning strikes) I lost interest in continuing the project. Fast forward to 2020 and I’m ready to give it another go. You can read more about the first iteration of the weather station here (https://github.com/BuckarewBanzai/Solar-Weather-Station)
Hardware And Sunshine ☀️
Lets go over the hardware for the weather station itself first. The design follows very closely to the original station. Essentially a weather proof Altelix NEMA enclosure, 35 watt solar panel, pwm charge controller, raspberry pi, and various sensors for collecting data.
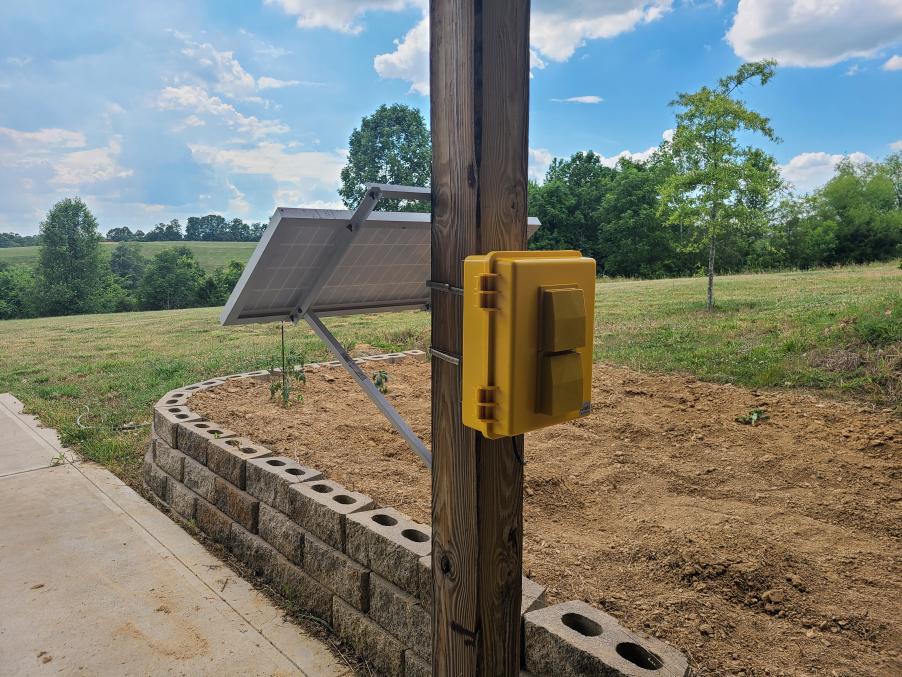
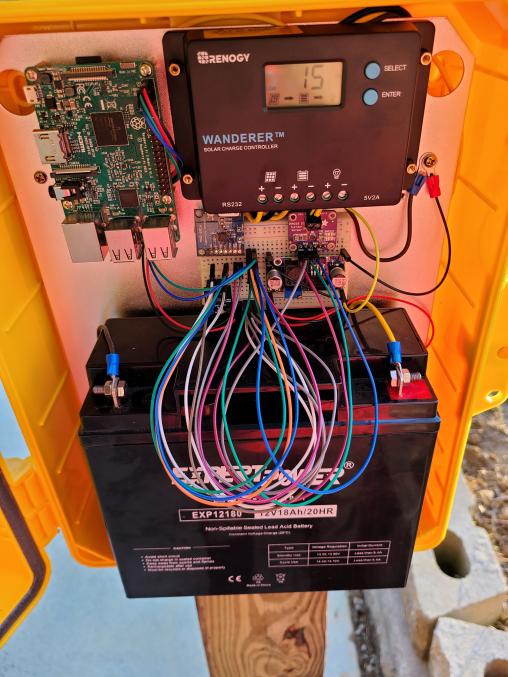
It is pretty busy inside the box. Power comes in from the solar panel into the charge controller. The charge controller manages the battery then provides power directly to a LM2596 switching regulator. The battery is a 18AH lead acid that should theoretically power the pi 3 days without sunshine. The sensors comprise of BME280 (Temperature, Pressure, Humidity), INA219 (DC current sensor), and a AS3935 Lightning sensor. All of these are connected to the pi over a I2C bus on the breadboard. I am working on a pcb design for these breakout boards that will be a more viable long term solution and less spaghetti.
The Brains 🧠
The software for this weather station is a huge improvement over the first one. Before, each sensor had its own script that was triggered with a cron job. These scripts would then take the collected data and write it to a local sqlite database. The raspberry pi became very power hungry and hosting the database and website frequently caused outages. This was all scrapped for a single python program that runs as a systemd service. This service collects data every 5 minutes and sends it to a offsite RESTful API.
The lightning sensor is capable of detecting strikes up to 40km away!
def handle_interrupt(channel):
        time.sleep(0.003)
        reason = sensor.get_interrupt()
        if reason == 0x01:
            print("Noise level too high - adjusting")
            nf = sensor.raise_noise_floor()
            print("Noise floor: " + str(nf))
        elif reason == 0x04:
            print("Noise event detected - masking")
            sensor.set_mask_disturber(True)
        elif reason == 0x08:
            distance = sensor.get_distance()
            print("Lightning detected")
            print(str(distance) + "km away. (%s)" % now)
APIs, Databases, Visualizations, Oh My… ⚙️
The Json data payload from our weather station is recieved by a RESTful API built on GoLang utilizing a ORM library. If you’re unfamiliar with ORM I go over some of the concepts in this previous post (http://zerogravityantfarm.com/post/python-orm-with-sqlalchemy/). The API is built and deployed as a docker container via a very hacky series of bash scripts of which you can find in the repository at the end. (Stay tuned for a proper CI/CD pipeline)
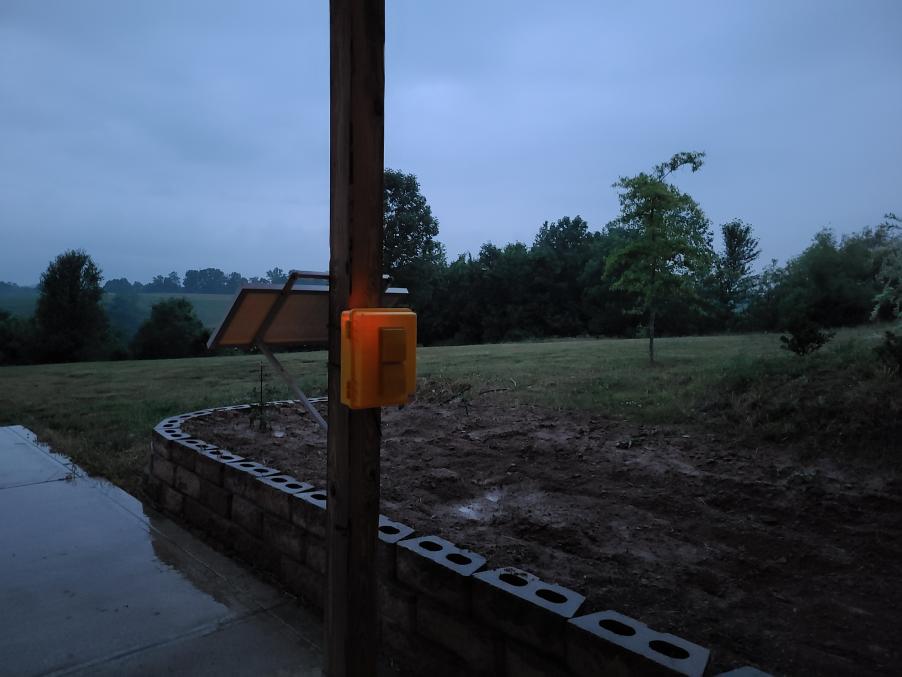
You can see the faint glow of the status leds during a summer time thunder storm.
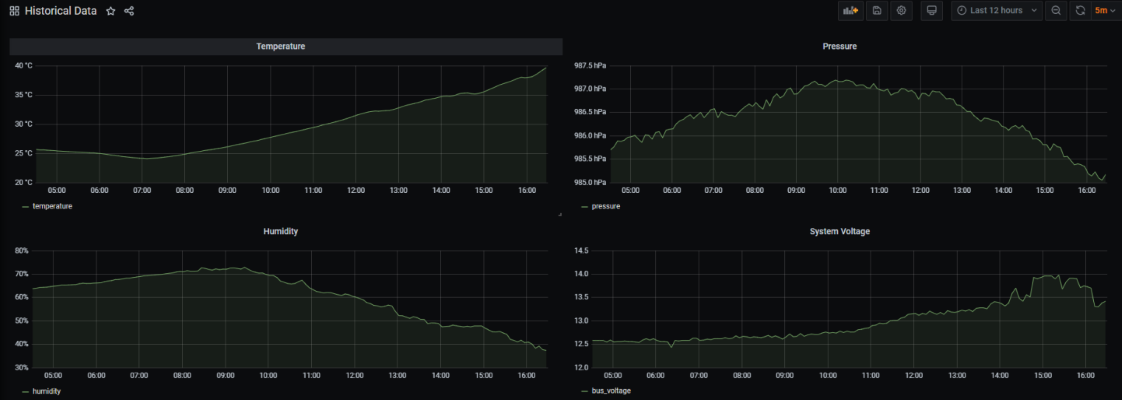
Once the API recieves a data payload, it translates the json to a sql query and sends it to a mysql server. The mysql server is also deployed as a docker container. When deployed with a docker volume we don’t have to worry about data loss when the container is stopped. I was really worried about using the old web front end as I am not very good at web development. Thankfully I found a data visualization tool called Grafana which can plug directly into the database.
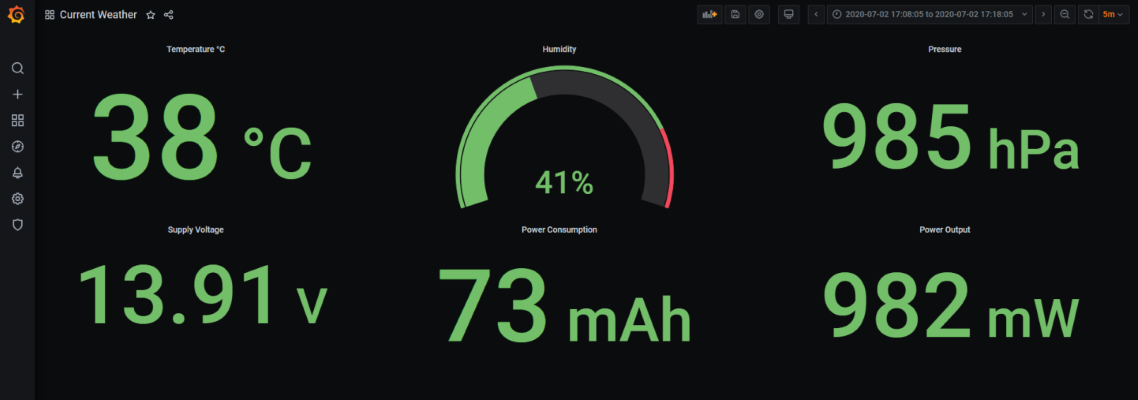
As you can see this allows for a very nice custom dashboard that auto updates with real time data. Each “gauge” is driven by a custom sql query that grabs the relevant data. This allows for some really cool time series graphs.
Now the question is what do we do with all this data? To be continued…
Full Code can be found here: https://github.com/BuckarewBanzai/Storm-Cloud
comments powered by Disqus